-
-
Car finance ›
-
‹ Back
-

TrustScore 4.4 | 16,546 reviews
-
-
‹ Back
-
Motorbike finance ›
-
‹ Back
-
TrustScore 4.4 | 16,546 reviews
-
-
‹ Back
-
Van finance ›
-
‹ Back
-
TrustScore 4.4 | 16,546 reviews
-
-
‹ Back
-
How it works ›
-
‹ Back
-
TrustScore 4.4 | 16,546 reviews
-
-
‹ Back
-
FAQs and guides ›
-
‹ Back
-
TrustScore 4.4 | 16,546 reviews
-
-
‹ Back
-
About us ›
-
‹ Back
-
TrustScore 4.4 | 16,546 reviews
-
-
‹ Back
-
TrustScore 4.4 | 16,546 reviews
-
Car finance ›
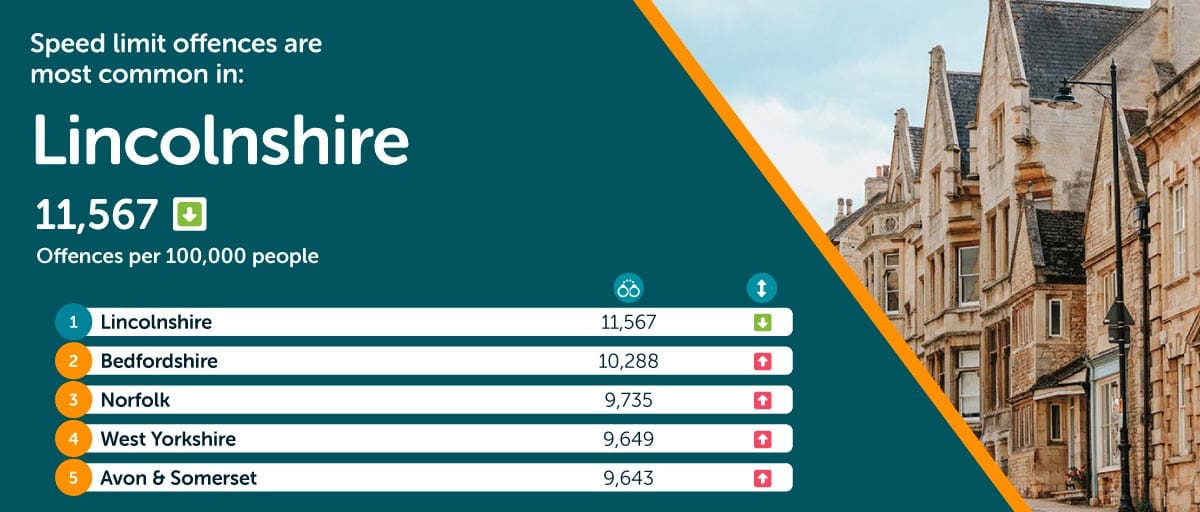
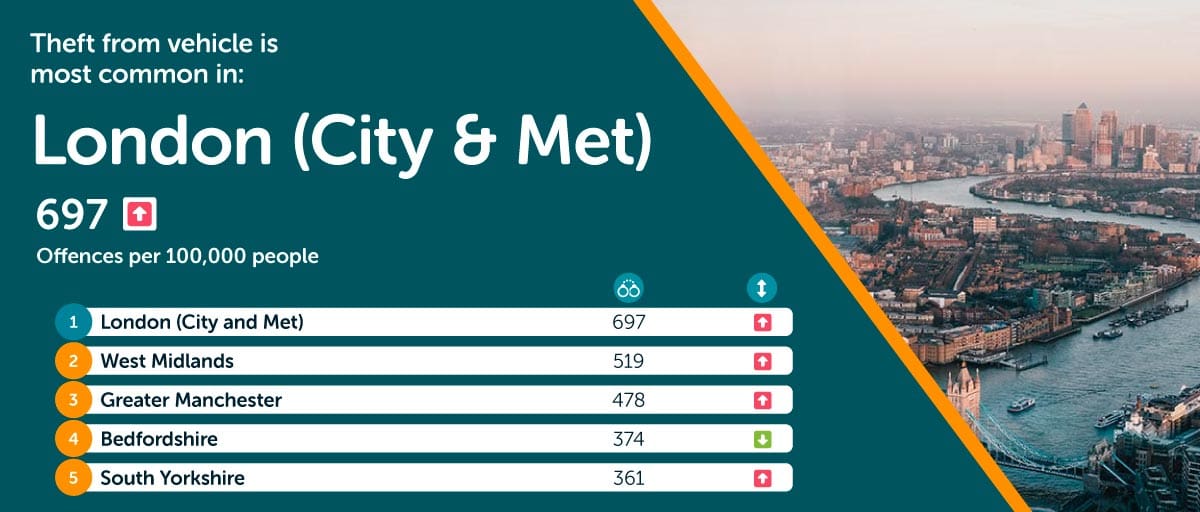
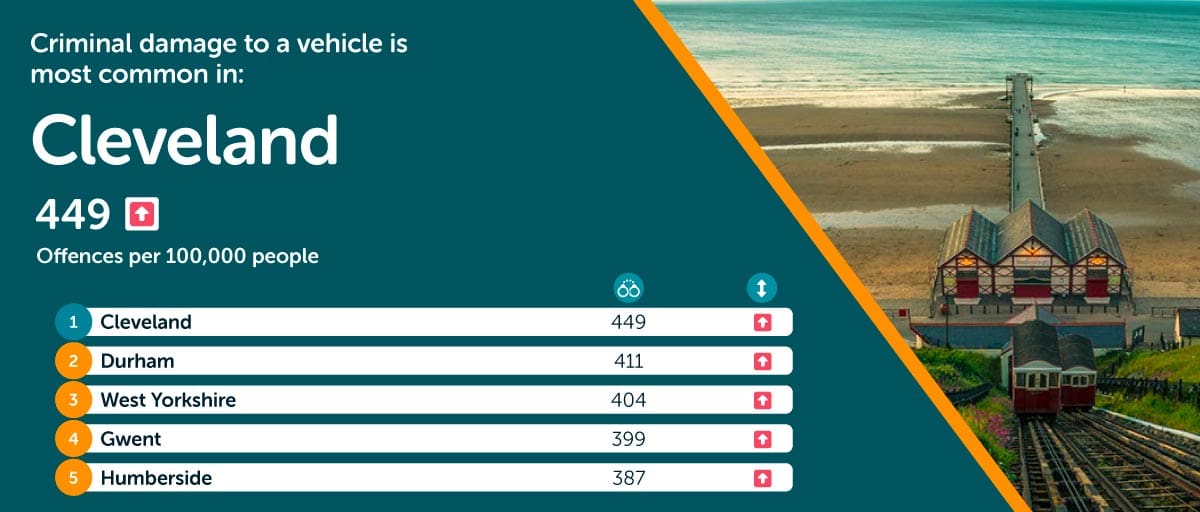
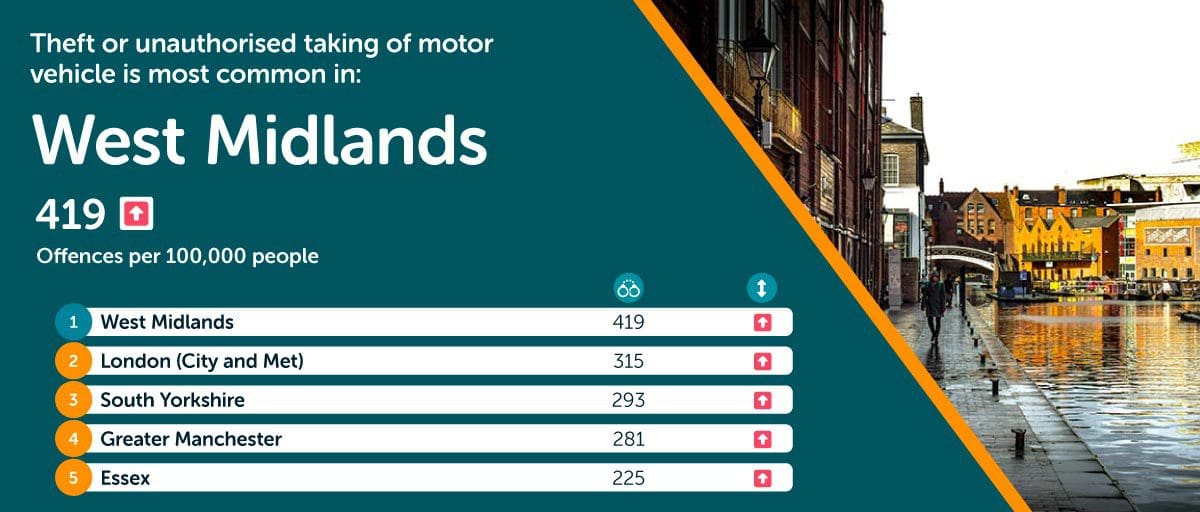
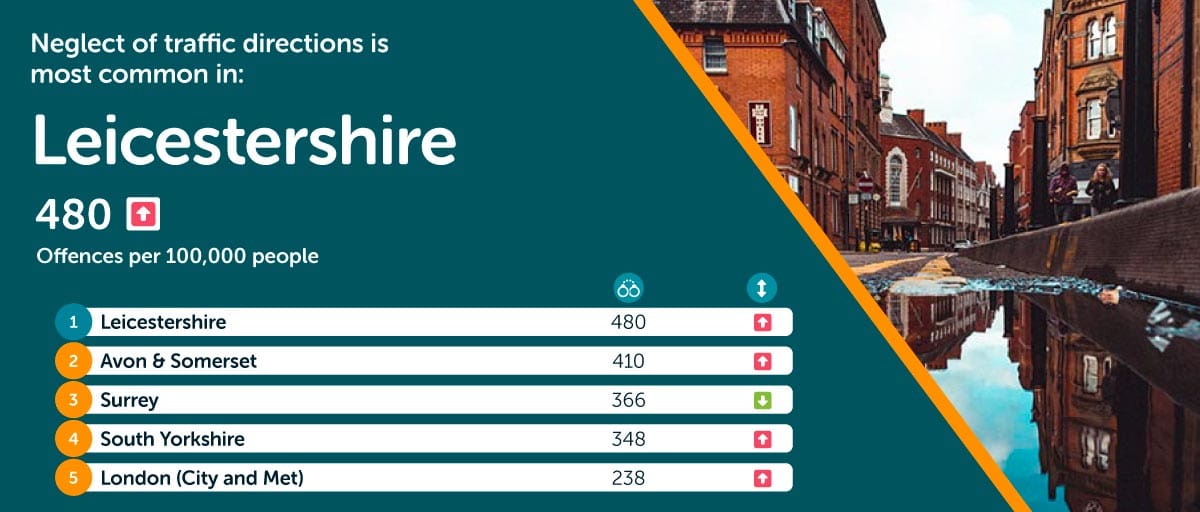
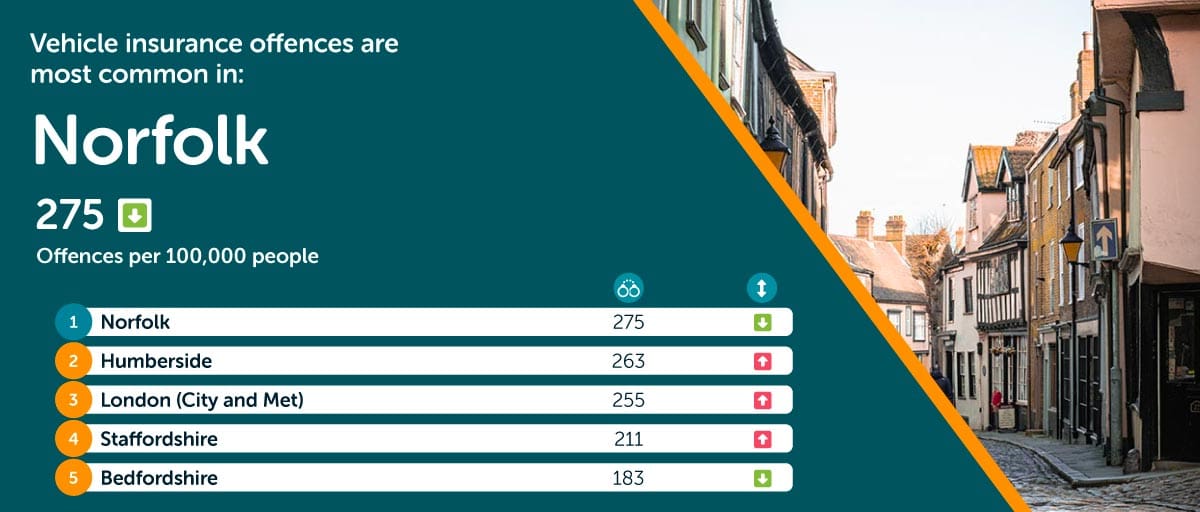
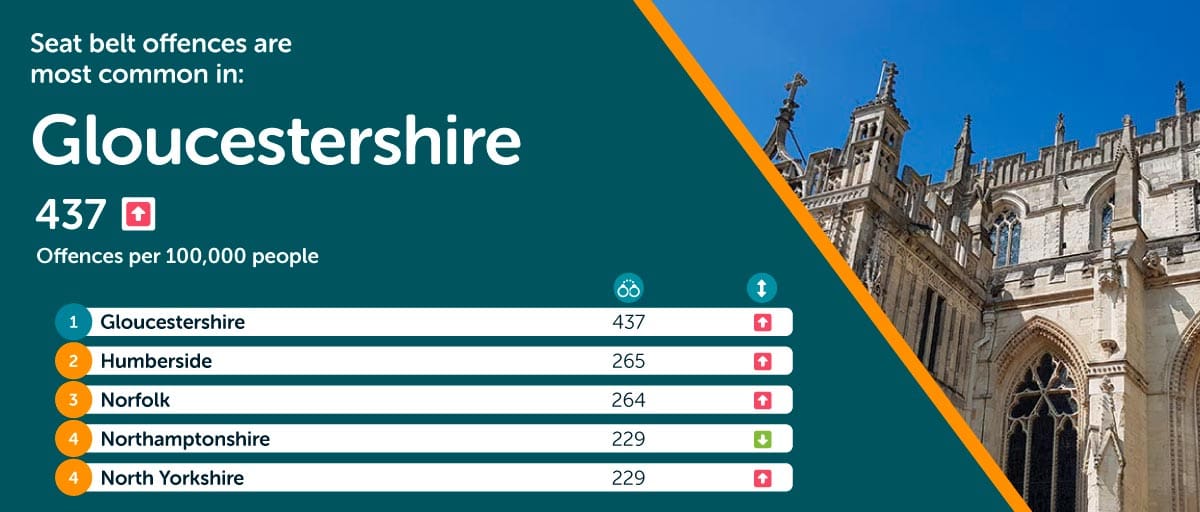
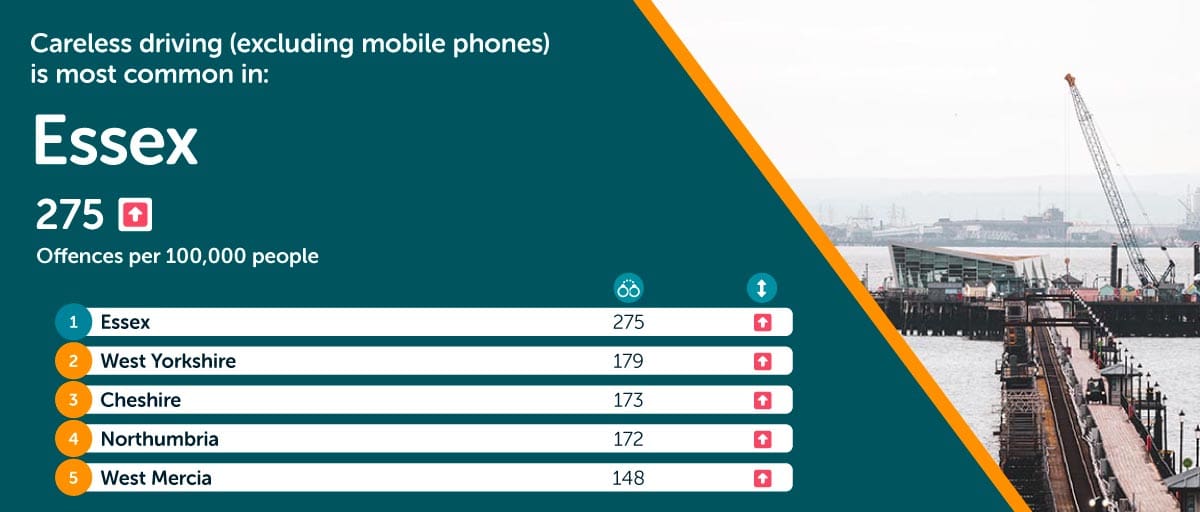
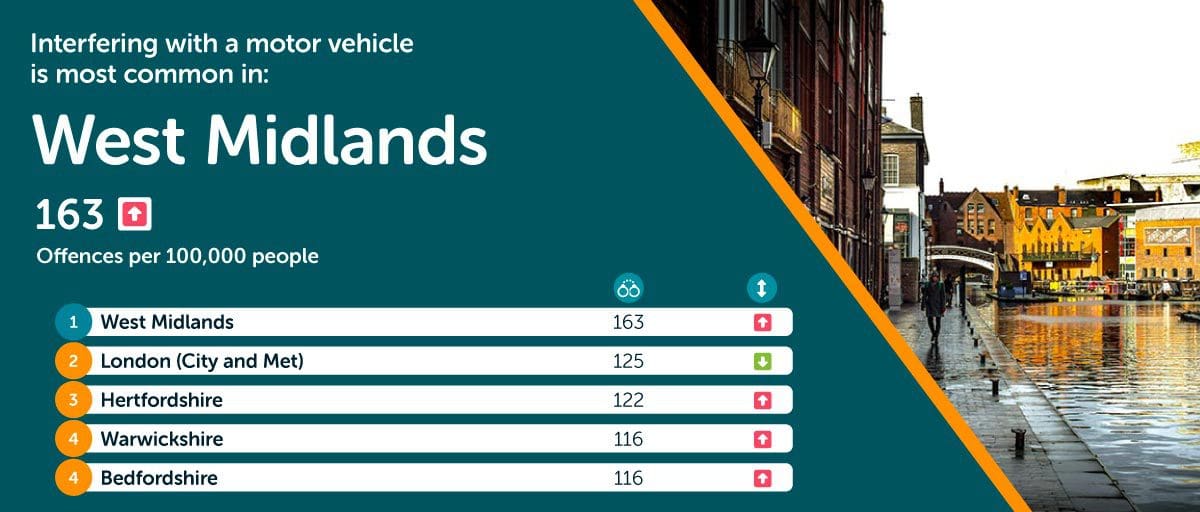
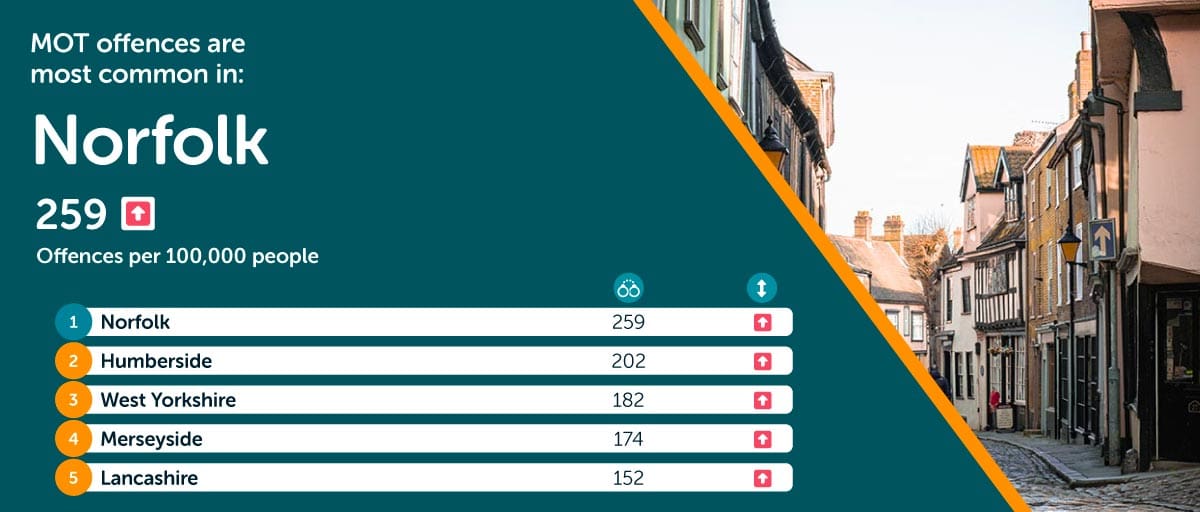
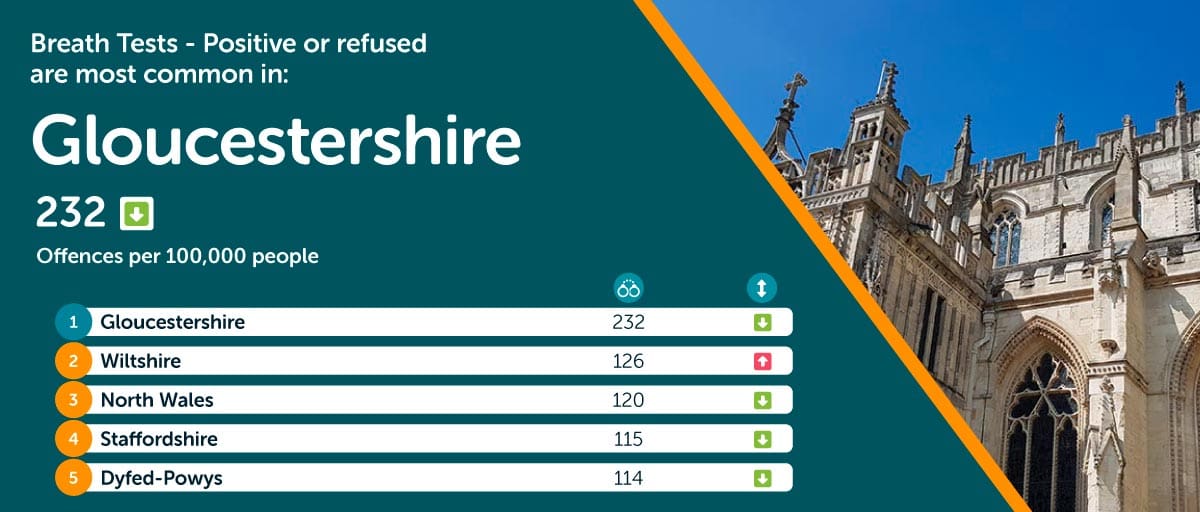
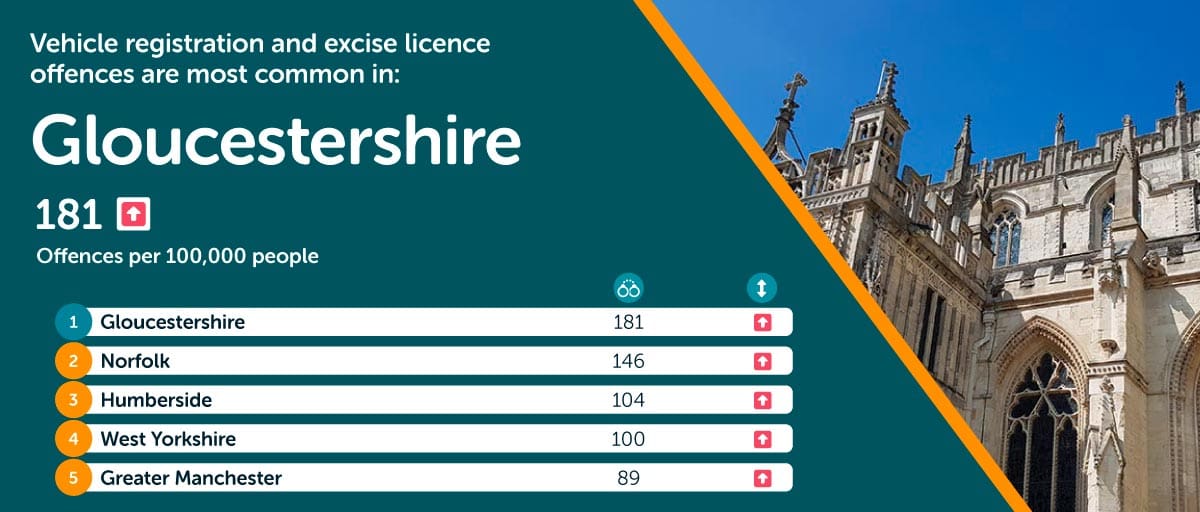
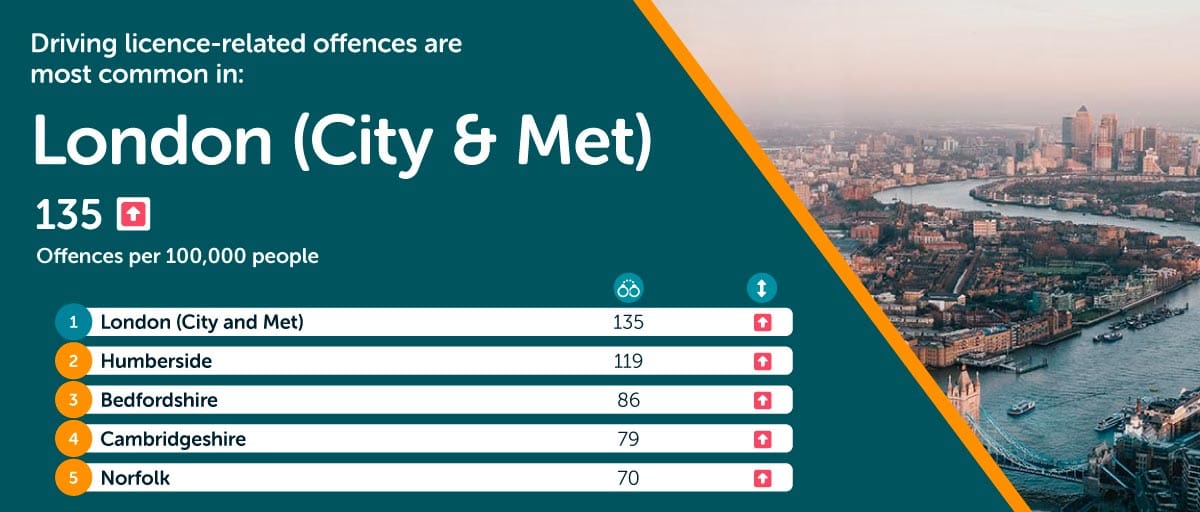
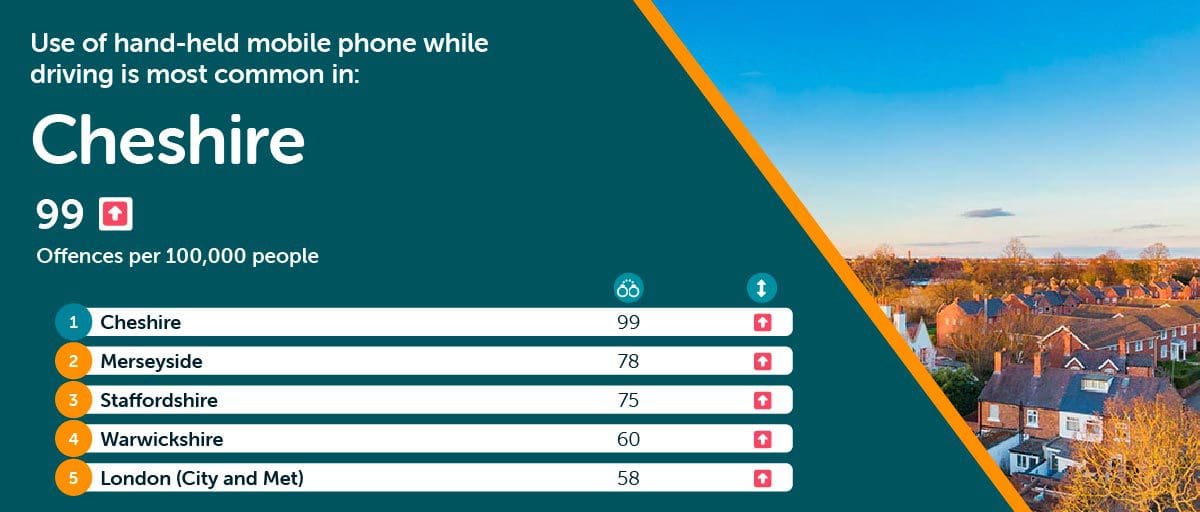
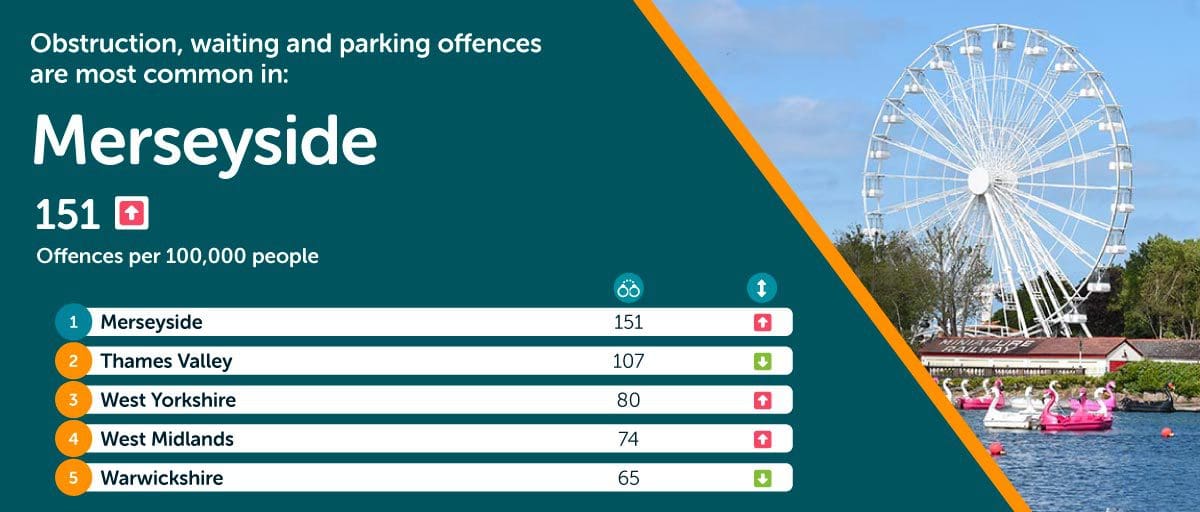
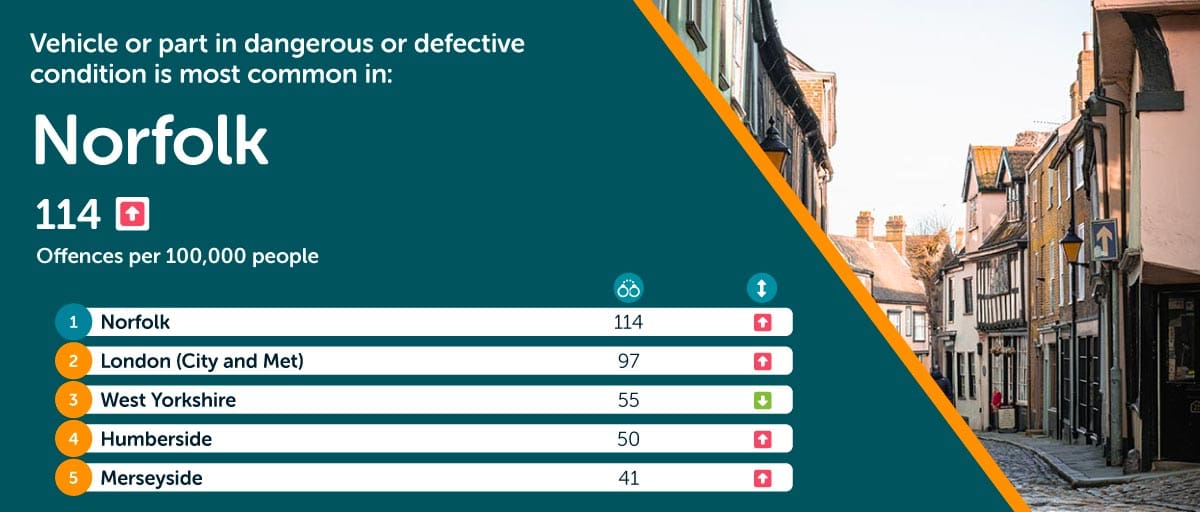
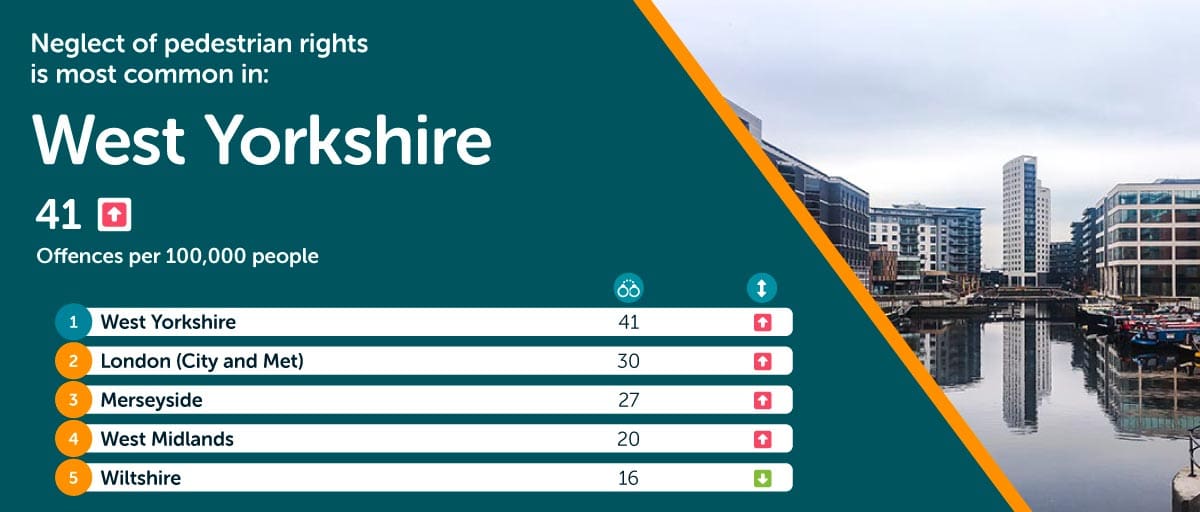
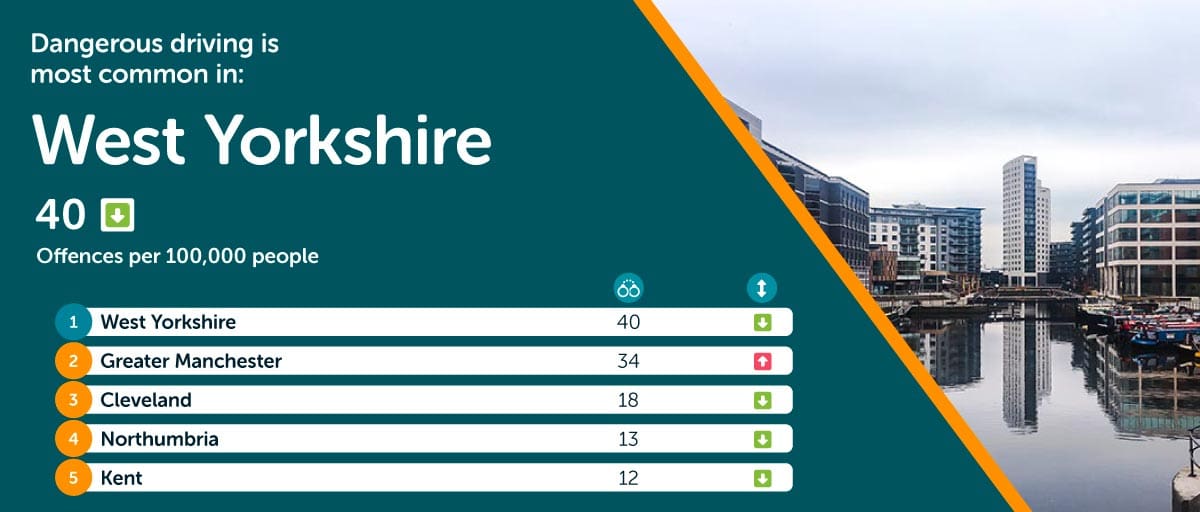
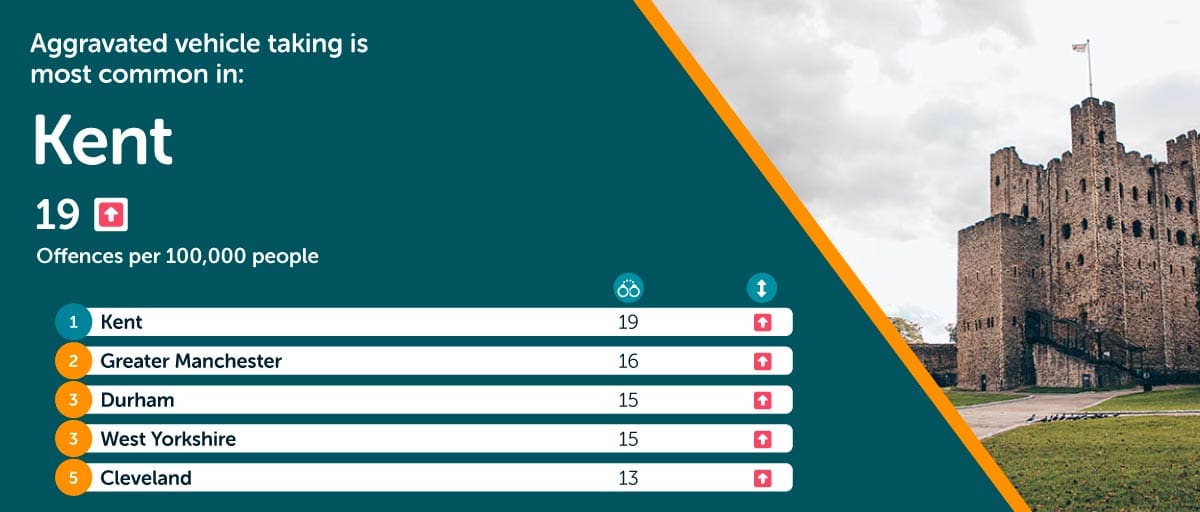
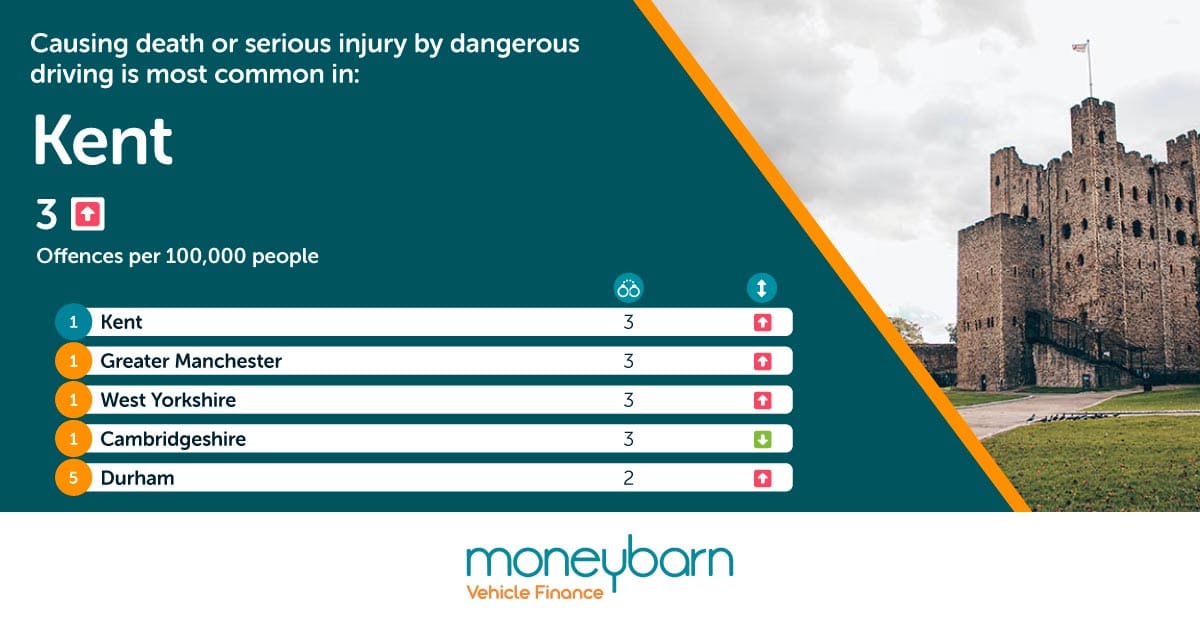
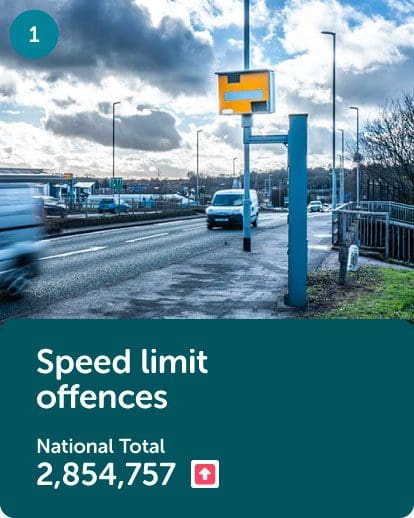
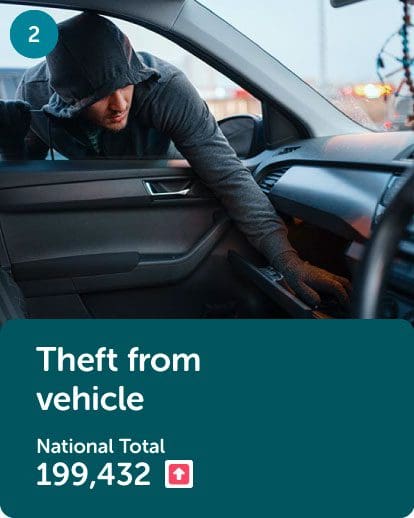
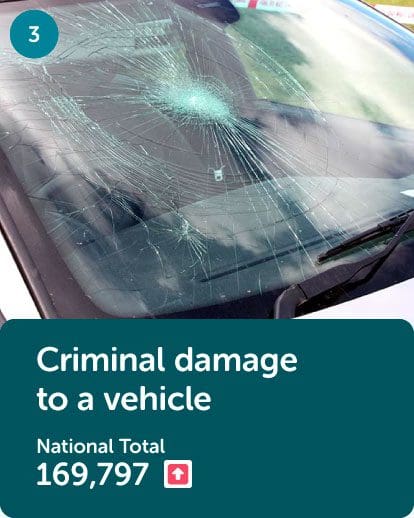
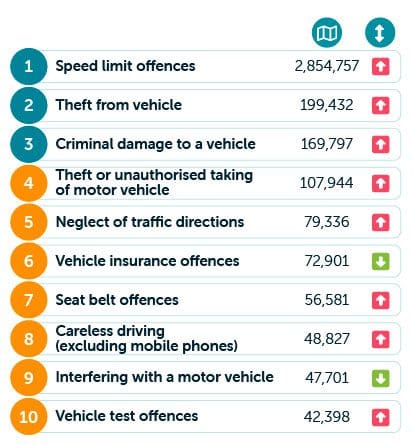
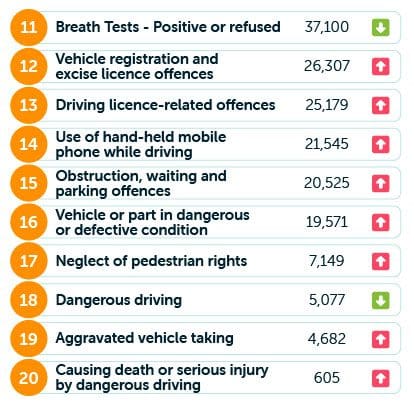
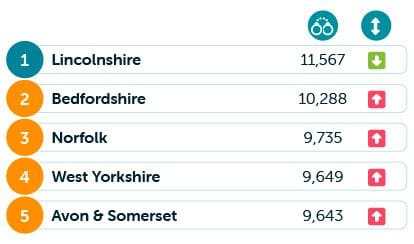
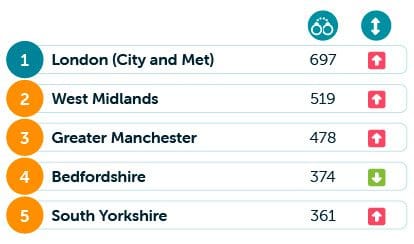
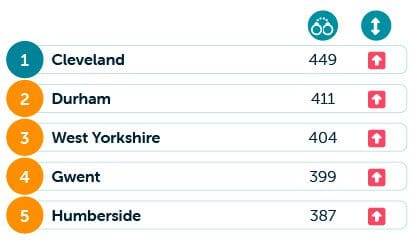
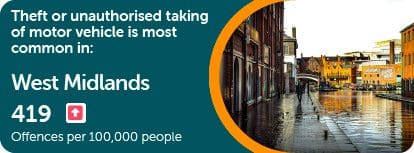
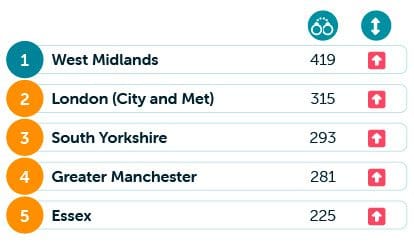
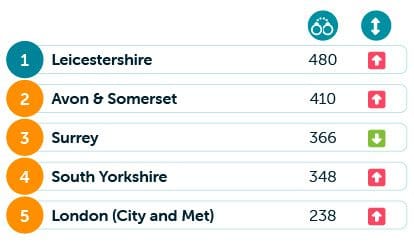
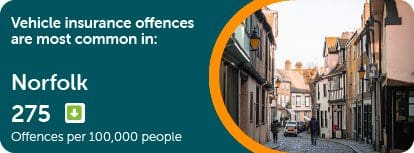
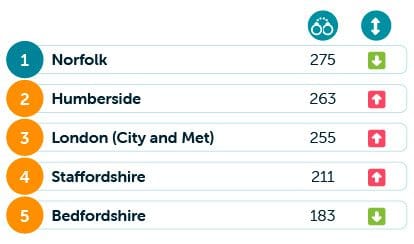
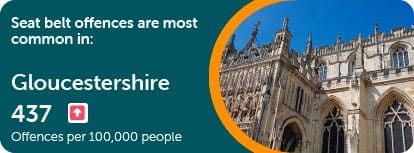
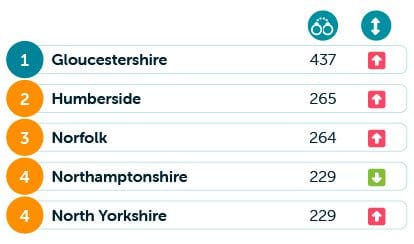
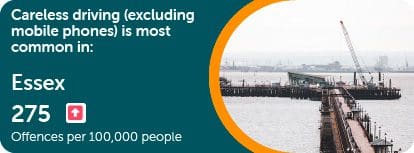
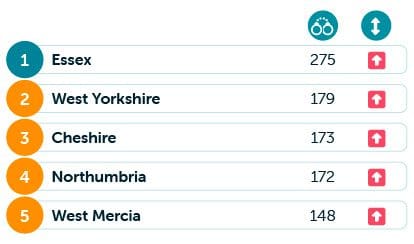
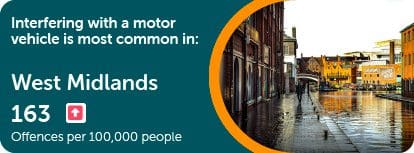
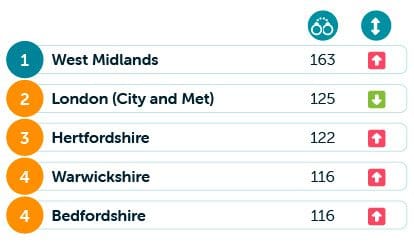
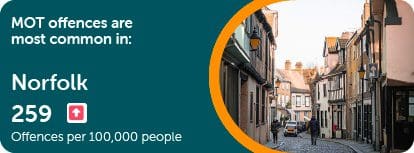
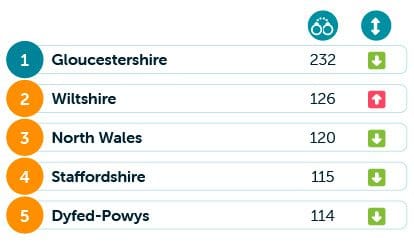
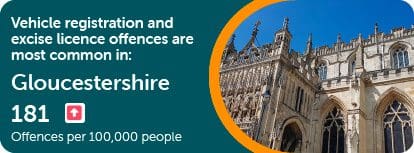
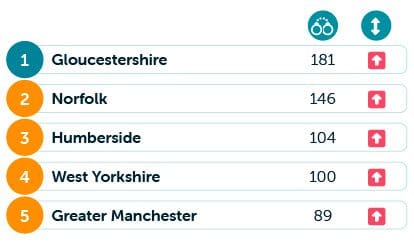
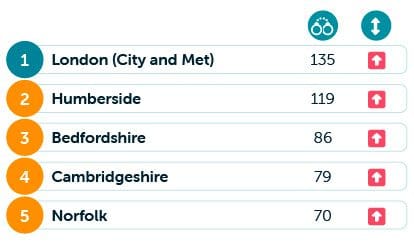
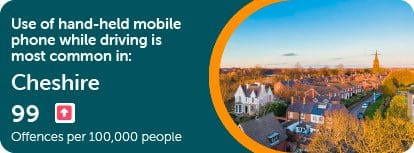
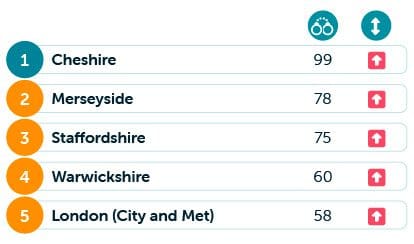
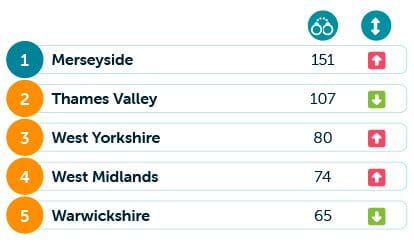
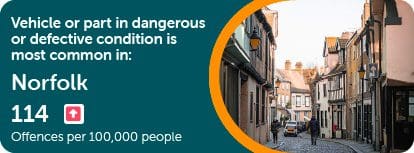
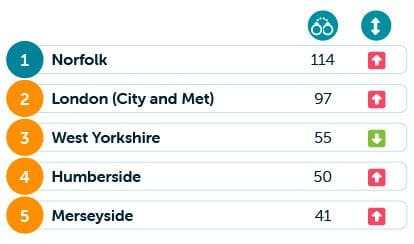
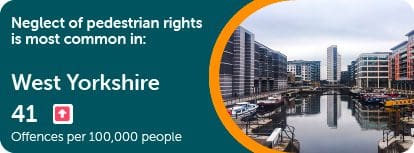
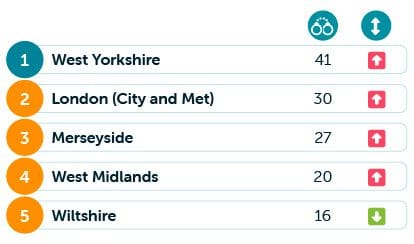
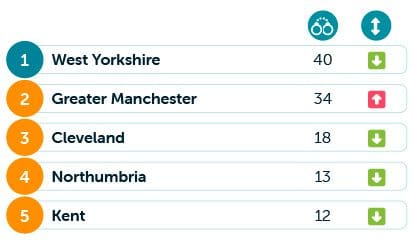
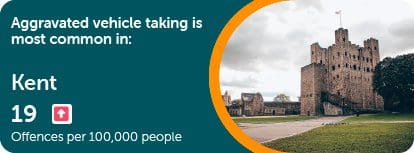
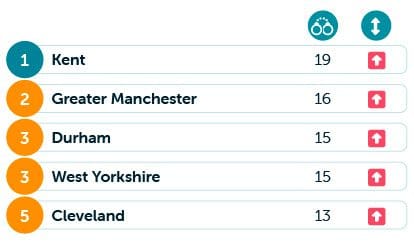
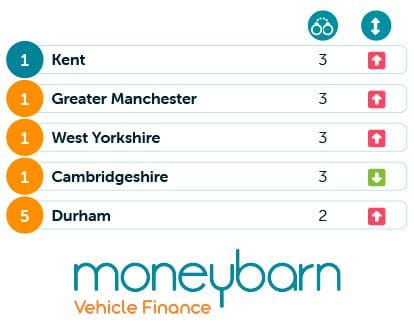
Car Crime Hotspots
Updated: Friday, 11 October 2024


For a better road ahead
Moneybarn is the trading style of Moneybarn No. 1 Limited, a company registered in England and Wales with company number 04496573. The registered address is Athena House, Bedford Road, Petersfield, Hampshire, GU32 3LJ.
Moneybarn’s VAT registration number is 180 5559 52.
Moneybarn No. 1 Limited is authorised and regulated by the Financial Conduct Authority (Financial Services reference No. 702780)